ICT Concepts: MML, Order Blocks, FVG, OTECore ICT Trading Concepts
These strategies are designed to identify high-probability trading opportunities by analyzing institutional order flow and market psychology.
1. Market Maker Liquidity (MML) / Liquidity Pools
Idea: Institutional traders ("market makers") place orders around key price levels where retail traders’ stop losses cluster (e.g., above swing highs or below swing lows).
Application: Look for "liquidity grabs" where price briefly spikes to these levels before reversing.
Example: If price breaks a recent high but reverses sharply, it may indicate a liquidity grab to trigger retail stops before a trend reversal.
2. Order Blocks (OB)
Idea: Institutional orders are often concentrated in specific price zones ("order blocks") where large buy/sell decisions occurred.
Application: Identify bullish order blocks (strong buying zones) or bearish order blocks (strong selling zones) on higher timeframes (e.g., 1H/4H charts).
Example: A bullish order block forms after a strong rally; price often retests this zone later as support.
3. Fair Value Gap (FVG)
Idea: A price imbalance occurs when candles gap without overlapping, creating an area of "unfair" price that the market often revisits.
Application: Trade the retracement to fill the FVG. A bullish FVG acts as support, and a bearish FVG acts as resistance.
Example: Three consecutive candles create a gap; price later returns to fill this gap, offering a entry point.
4. Time-Based Analysis (NY Session, London Kill Zones)
Idea: Institutional activity peaks during specific times (e.g., 7 AM – 11 AM New York time).
Application: Focus on trades during high-liquidity periods when banks and hedge funds are active.
Example: The "London Kill Zone" (2 AM – 5 AM EST) often sees volatility due to European market openings.
5. Optimal Trade Entry (OTE)
Idea: A retracement level (similar to Fibonacci retracement) where institutions re-enter trends after a pullback.
Application: Look for 62–79% retracements in a trend to align with institutional accumulation/distribution zones.
Example: In an uptrend, price retraces 70% before resuming upward—enter long here.
6. Stop Hunts
Idea: Institutions manipulate price to trigger retail stop losses before reversing direction.
Application: Avoid placing stops at obvious levels (e.g., above/below recent swings). Instead, use wider stops or wait for confirmation.
Search in scripts for "fair value gap"

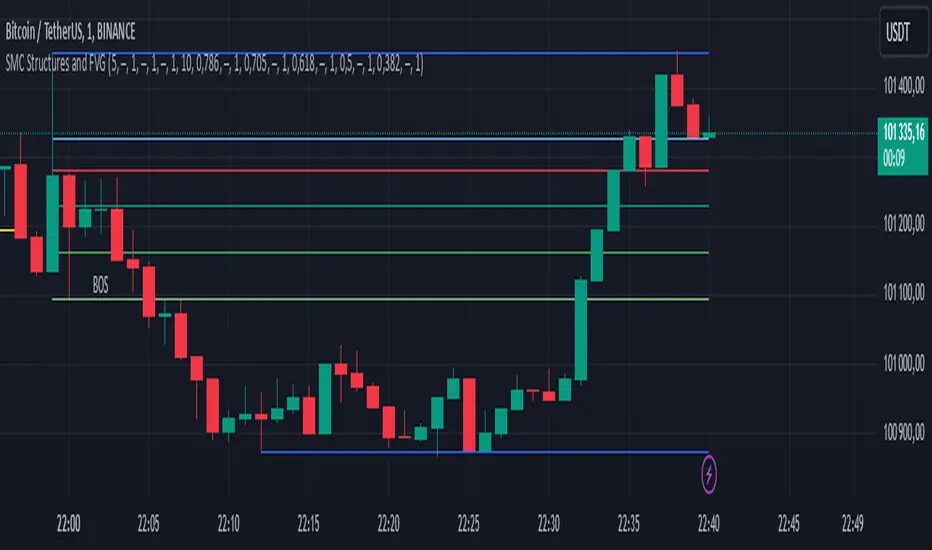
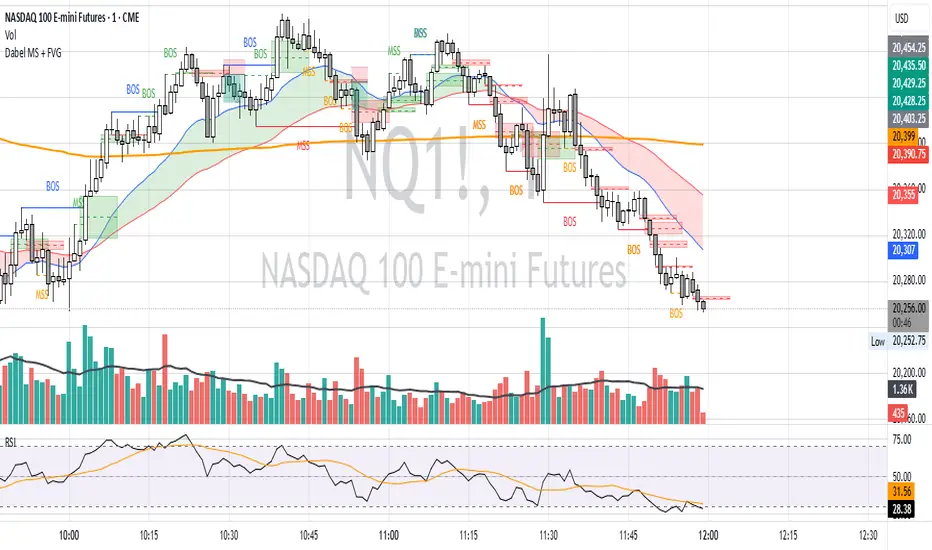
Dabel MS + FVGThis script is designed to assist traders by identifying market structures, imbalances, and potential trade opportunities using Break of Structure (BOS) and Market Structure Shifts (MSS). It visually highlights imbalances in price action, key pivots, and market structure changes, providing actionable information for making trading decisions.
Key features:
Imbalances Detection: Highlights bullish and bearish price gaps (Fair Value Gaps) using colored boxes. Users can choose the line style (solid, dashed, or dotted) for imbalance midlines.
Market Structure Analysis: Tracks pivot highs and lows to identify BOS and MSS in two separate market structures with adjustable pivot strengths.
Customizable Visualization: Allows users to choose line styles, colors, and display options for both imbalances and market structures.
Alerts: Alerts traders when BOS or MSS occur, helping to monitor the market effectively.
Trading Strategy
Imbalance Trading:
Imbalances (gaps) represent areas where supply or demand was left unfilled. These gaps often act as magnet zones where the price revisits to fill.
Bullish Imbalance: Look for buying opportunities when price enters a green imbalance zone.
Bearish Imbalance: Look for selling opportunities when price enters a red imbalance zone.
Use the midline of the imbalance box as a key reference point for potential reversals.
Break of Structure (BOS) and Market Structure Shift (MSS):
BOS: Indicates a continuation of the existing trend. For example:
Bullish BOS: Look for continuation in the uptrend after a high is broken.
Bearish BOS: Look for continuation in the downtrend after a low is broken.
MSS: Suggests a potential reversal in market structure. For example:
Bullish MSS: Indicates a possible shift from a bearish to bullish market.
Bearish MSS: Indicates a potential shift from a bullish to bearish market.
Multiple Market Structures:
This script provide two sets of market structures, allowing traders to compare short-term and long-term trends.
Adjust the pivot strength to suit your trading style (lower for intraday trading, higher for swing or positional trading).
Entry and Exit:
Entry: Look for entries near imbalances or after confirmed BOS/MSS in line with the overall trend.
Exit: Place stop-loss below/above recent pivots and take profit at nearby support/resistance or imbalance zones.
For New Traders
Focus on Basics: Understand what BOS and MSS mean and how they signal trend direction or reversals.
Use Alerts: Rely on the script's alert system to catch important moments without staring at charts all day.
Start Small: Test this strategy on a demo account before using it live. You can understand it more with practice.
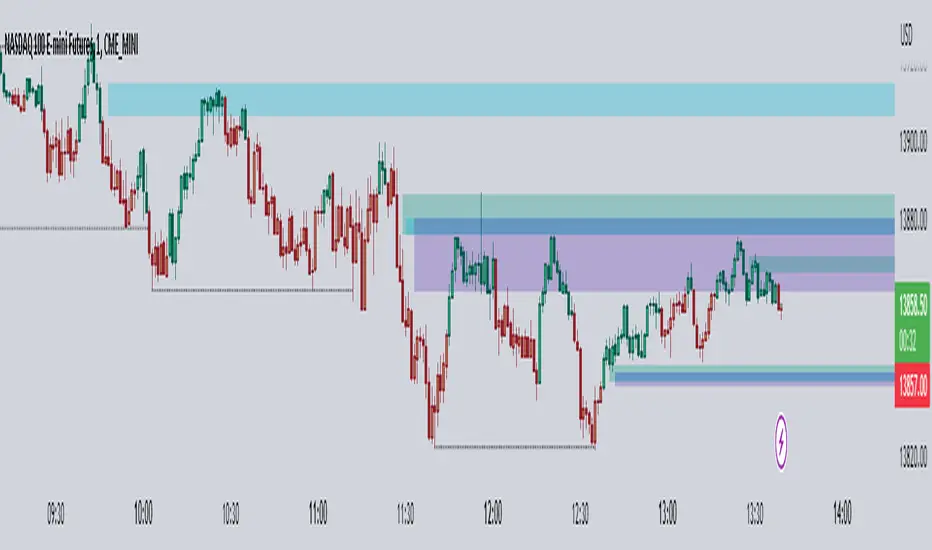
Multi-Timeframe FVG [TFO]The goal of this indicator is to find Fair Value Gaps (FVGs) that overlap on multiple timeframes. FVGs are already meant to be “sensitive” areas where one might expect price to react from, therefore FVGs that overlap on multiple timeframes could provide even more confluence that there may be a reaction in said area (with proper context).
Mitigation Type allows users to select how FVGs should be mitigated, either by wick or by completely closing through the area.
The displacement option helps to filter out smaller FVGs by looking for areas where price ran rather quickly (causing displacement). This is done by comparing the candle that made the FVG to a fractional ATR value, so that one may fine-tune how much “larger” the candle range needs to be, relative to recent price action.
The timeframe alignment option allows users to select how many timeframes must be converging in order to draw FVGs. For instance, with all timeframes selected, a timeframe alignment value of 2 would require that there be overlapping FVGs on 2 or more timeframes. A value of 3 would require that there be overlapping FVGs on all 3 timeframes in order for them to be drawn.
SpatialIndexYou can start using this now by inserthing this at the top of your indicator/strategy/library.
import ArunaReborn/SpatialIndex/1 as SI
Overview
SpatialIndex is a high-performance Pine Script library that implements price-bucketed spatial indexing for efficient proximity queries on large datasets. Instead of scanning through hundreds or thousands of items linearly (O(n)), this library provides O(k) bucket lookup where k is typically just a handful of buckets, dramatically improving performance for price-based filtering operations.
This library works with any data type through index-based references, making it universally applicable for support/resistance levels, pivot points, order zones, pattern detection points, Fair Value Gaps, and any other price-based data that needs frequent proximity queries.
Why This Library Exists
The Problem
When building advanced technical indicators that track large numbers of price levels (support/resistance zones, pivot points, order blocks, etc.), you often need to answer questions like:
- *"Which levels are within 5% of the current price?"*
- *"What zones overlap with this price range?"*
- *"Are there any significant levels near my entry point?"*
The naive approach is to loop through every single item and check its price. For 500 levels across multiple timeframes, this means 500 comparisons every bar . On instruments with thousands of historical bars, this quickly becomes a performance bottleneck that can cause scripts to time out or lag.
The Solution
SpatialIndex solves this by organizing items into price buckets —like filing cabinets organized by price range. When you query for items near $50,000, the library only looks in the relevant buckets (e.g., $49,000-$51,000 range), ignoring all other price regions entirely.
Performance Example:
- Linear scan: Check 500 items = 500 comparisons per query
- Spatial index: Check 3-5 buckets with ~10 items each = 30-50 comparisons per query
- Result: 10-16x faster queries
Key Features
Core Capabilities
- ✅ Generic Design : Works with any data type via index references
- ✅ Multiple Index Strategies : Fixed bucket size or ATR-based dynamic sizing
- ✅ Range Support : Index items that span price ranges (zones, gaps, channels)
- ✅ Efficient Queries : O(k) bucket lookup instead of O(n) linear scan
- ✅ Multiple Query Types : Proximity percentage, fixed range, exact price with tolerance
- ✅ Dynamic Updates : Add, remove, update items in O(1) time
- ✅ Batch Operations : Efficient bulk removal and reindexing
- ✅ Query Caching : Optional caching for repeated queries within same bar
- ✅ Statistics & Debugging : Built-in stats and diagnostic functions
### Advanced Features
- ATR-Based Bucketing : Automatically adjusts bucket sizes based on volatility
- Multi-Bucket Spanning : Items that span ranges are indexed in all overlapping buckets
- Reindexing Support : Handles array removals with automatic index shifting
- Cache Management : Configurable query caching with automatic invalidation
- Empty Bucket Cleanup : Automatically removes empty buckets to minimize memory
How It Works
The Bucketing Concept
Think of price space as divided into discrete buckets, like a histogram:
```
Price Range: $98-$100 $100-$102 $102-$104 $104-$106 $106-$108
Bucket Key: 49 50 51 52 53
Items:
```
When you query for items near $103:
1. Calculate which buckets overlap the $101.50-$104.50 range (keys 50, 51, 52)
2. Return items from only those buckets:
3. Never check items in buckets 49 or 53
Bucket Size Selection
Fixed Size Mode:
```pine
var SI.SpatialBucket index = SI.newSpatialBucket(2.0) // $2 per bucket
```
- Good for: Instruments with stable price ranges
- Example: For stocks trading at $100, 2.0 = 2% increments
ATR-Based Mode:
```pine
float atr = ta.atr(14)
var SI.SpatialBucket index = SI.newSpatialBucketATR(1.0, atr) // 1x ATR per bucket
SI.updateATR(index, atr) // Update each bar
```
- Good for: Instruments with varying volatility
- Adapts automatically to market conditions
- 1.0 multiplier = one bucket spans one ATR unit
Optimal Bucket Size:
The library includes a helper function to calculate optimal size:
```pine
float optimalSize = SI.calculateOptimalBucketSize(close, 5.0) // For 5% proximity queries
```
This ensures queries span approximately 3 buckets for optimal performance.
Index-Based Architecture
The library doesn't store your actual data—it only stores indices that point to your external arrays:
```pine
// Your data
var array levels = array.new()
var array types = array.new()
var array ages = array.new()
// Your index
var SI.SpatialBucket index = SI.newSpatialBucket(2.0)
// Add a level
array.push(levels, 50000.0)
array.push(types, "support")
array.push(ages, 0)
SI.add(index, array.size(levels) - 1, 50000.0) // Store index 0
// Query near current price
SI.QueryResult result = SI.queryProximity(index, close, 5.0)
for idx in result.indices
float level = array.get(levels, idx)
string type = array.get(types, idx)
// Work with your actual data
```
This design means:
- ✅ Works with any data structure you define
- ✅ No data duplication
- ✅ Minimal memory footprint
- ✅ Full control over your data
---
Usage Guide
Basic Setup
```pine
// Import library
import username/SpatialIndex/1 as SI
// Create index
var SI.SpatialBucket index = SI.newSpatialBucket(2.0)
// Your data arrays
var array supportLevels = array.new()
var array touchCounts = array.new()
```
Adding Items
Single Price Point:
```pine
// Add a support level at $50,000
array.push(supportLevels, 50000.0)
array.push(touchCounts, 1)
int levelIdx = array.size(supportLevels) - 1
SI.add(index, levelIdx, 50000.0)
```
Price Range (Zones/Gaps):
```pine
// Add a resistance zone from $51,000 to $52,000
array.push(zoneBottoms, 51000.0)
array.push(zoneTops, 52000.0)
int zoneIdx = array.size(zoneBottoms) - 1
SI.addRange(index, zoneIdx, 51000.0, 52000.0) // Indexed in all overlapping buckets
```
Querying Items
Proximity Query (Percentage):
```pine
// Find all levels within 5% of current price
SI.QueryResult result = SI.queryProximity(index, close, 5.0)
if array.size(result.indices) > 0
for idx in result.indices
float level = array.get(supportLevels, idx)
// Process nearby level
```
Fixed Range Query:
```pine
// Find all items between $49,000 and $51,000
SI.QueryResult result = SI.queryRange(index, 49000.0, 51000.0)
```
Exact Price with Tolerance:
```pine
// Find items at exactly $50,000 +/- $100
SI.QueryResult result = SI.queryAt(index, 50000.0, 100.0)
```
Removing Items
Safe Removal Pattern:
```pine
SI.QueryResult result = SI.queryProximity(index, close, 5.0)
if array.size(result.indices) > 0
// IMPORTANT: Sort descending to safely remove from arrays
array sorted = SI.sortIndicesDescending(result)
for idx in sorted
// Remove from index
SI.remove(index, idx)
// Remove from your data arrays
array.remove(supportLevels, idx)
array.remove(touchCounts, idx)
// Reindex to maintain consistency
SI.reindexAfterRemoval(index, idx)
```
Batch Removal (More Efficient):
```pine
// Collect indices to remove
array toRemove = array.new()
for i = 0 to array.size(supportLevels) - 1
if array.get(touchCounts, i) > 10 // Remove old levels
array.push(toRemove, i)
// Remove in descending order from data arrays
array sorted = array.copy(toRemove)
array.sort(sorted, order.descending)
for idx in sorted
SI.remove(index, idx)
array.remove(supportLevels, idx)
array.remove(touchCounts, idx)
// Batch reindex (much faster than individual reindexing)
SI.reindexAfterBatchRemoval(index, toRemove)
```
Updating Items
```pine
// Update a level's price (e.g., after refinement)
float newPrice = 50100.0
SI.update(index, levelIdx, newPrice)
array.set(supportLevels, levelIdx, newPrice)
// Update a zone's range
SI.updateRange(index, zoneIdx, 51000.0, 52500.0)
array.set(zoneBottoms, zoneIdx, 51000.0)
array.set(zoneTops, zoneIdx, 52500.0)
```
Query Caching
For repeated queries within the same bar:
```pine
// Create cache (persistent)
var SI.CachedQuery cache = SI.newCachedQuery()
// Cached query (returns cached result if parameters match)
SI.QueryResult result = SI.queryProximityCached(
index,
cache,
close,
5.0, // proximity%
1 // cache duration in bars
)
// Invalidate cache when index changes significantly
if bigChangeDetected
SI.invalidateCache(cache)
```
---
Practical Examples
Example 1: Support/Resistance Finder
```pine
//@version=6
indicator("S/R with Spatial Index", overlay=true)
import username/SpatialIndex/1 as SI
// Data storage
var array levels = array.new()
var array types = array.new() // "support" or "resistance"
var array touches = array.new()
var array ages = array.new()
// Spatial index
var SI.SpatialBucket index = SI.newSpatialBucket(close * 0.02) // 2% buckets
// Detect pivots
bool isPivotHigh = ta.pivothigh(high, 5, 5)
bool isPivotLow = ta.pivotlow(low, 5, 5)
// Add new levels
if isPivotHigh
array.push(levels, high )
array.push(types, "resistance")
array.push(touches, 1)
array.push(ages, 0)
SI.add(index, array.size(levels) - 1, high )
if isPivotLow
array.push(levels, low )
array.push(types, "support")
array.push(touches, 1)
array.push(ages, 0)
SI.add(index, array.size(levels) - 1, low )
// Find nearby levels (fast!)
SI.QueryResult nearby = SI.queryProximity(index, close, 3.0) // Within 3%
// Process nearby levels
for idx in nearby.indices
float level = array.get(levels, idx)
string type = array.get(types, idx)
// Check for touch
if type == "support" and low <= level and low > level
array.set(touches, idx, array.get(touches, idx) + 1)
else if type == "resistance" and high >= level and high < level
array.set(touches, idx, array.get(touches, idx) + 1)
// Age and cleanup old levels
for i = array.size(ages) - 1 to 0
array.set(ages, i, array.get(ages, i) + 1)
// Remove levels older than 500 bars or with 5+ touches
if array.get(ages, i) > 500 or array.get(touches, i) >= 5
SI.remove(index, i)
array.remove(levels, i)
array.remove(types, i)
array.remove(touches, i)
array.remove(ages, i)
SI.reindexAfterRemoval(index, i)
// Visualization
for idx in nearby.indices
line.new(bar_index, array.get(levels, idx), bar_index + 10, array.get(levels, idx),
color=array.get(types, idx) == "support" ? color.green : color.red)
```
Example 2: Multi-Timeframe Zone Detector
```pine
//@version=6
indicator("MTF Zones", overlay=true)
import username/SpatialIndex/1 as SI
// Store zones from multiple timeframes
var array zoneBottoms = array.new()
var array zoneTops = array.new()
var array zoneTimeframes = array.new()
// ATR-based spatial index for adaptive bucketing
var SI.SpatialBucket index = SI.newSpatialBucketATR(1.0, ta.atr(14))
SI.updateATR(index, ta.atr(14)) // Update bucket size with volatility
// Request higher timeframe data
= request.security(syminfo.tickerid, "240", )
// Detect HTF zones
if not na(htf_high) and not na(htf_low)
float zoneTop = htf_high
float zoneBottom = htf_low * 0.995 // 0.5% zone thickness
// Check if zone already exists nearby
SI.QueryResult existing = SI.queryRange(index, zoneBottom, zoneTop)
if array.size(existing.indices) == 0 // No overlapping zones
// Add new zone
array.push(zoneBottoms, zoneBottom)
array.push(zoneTops, zoneTop)
array.push(zoneTimeframes, "4H")
int idx = array.size(zoneBottoms) - 1
SI.addRange(index, idx, zoneBottom, zoneTop)
// Query zones near current price
SI.QueryResult nearbyZones = SI.queryProximity(index, close, 2.0) // Within 2%
// Highlight nearby zones
for idx in nearbyZones.indices
box.new(bar_index - 50, array.get(zoneBottoms, idx),
bar_index, array.get(zoneTops, idx),
bgcolor=color.new(color.blue, 90))
```
### Example 3: Performance Comparison
```pine
//@version=6
indicator("Spatial Index Performance Test")
import username/SpatialIndex/1 as SI
// Generate 500 random levels
var array levels = array.new()
var SI.SpatialBucket index = SI.newSpatialBucket(close * 0.02)
if bar_index == 0
for i = 0 to 499
float randomLevel = close * (0.9 + math.random() * 0.2) // +/- 10%
array.push(levels, randomLevel)
SI.add(index, i, randomLevel)
// Method 1: Linear scan (naive approach)
int linearCount = 0
float proximityPct = 5.0
float lowBand = close * (1 - proximityPct/100)
float highBand = close * (1 + proximityPct/100)
for i = 0 to array.size(levels) - 1
float level = array.get(levels, i)
if level >= lowBand and level <= highBand
linearCount += 1
// Method 2: Spatial index query
SI.QueryResult result = SI.queryProximity(index, close, proximityPct)
int spatialCount = array.size(result.indices)
// Compare performance
plot(result.queryCount, "Items Examined (Spatial)", color=color.green)
plot(linearCount, "Items Examined (Linear)", color=color.red)
plot(spatialCount, "Results Found", color=color.blue)
// Spatial index typically examines 10-50 items vs 500 for linear scan!
```
API Reference Summary
Initialization
- `newSpatialBucket(bucketSize)` - Fixed bucket size
- `newSpatialBucketATR(atrMultiplier, atrValue)` - ATR-based buckets
- `updateATR(sb, newATR)` - Update ATR for dynamic sizing
Adding Items
- `add(sb, itemIndex, price)` - Add item at single price point
- `addRange(sb, itemIndex, priceBottom, priceTop)` - Add item spanning range
Querying
- `queryProximity(sb, refPrice, proximityPercent)` - Query by percentage
- `queryRange(sb, priceBottom, priceTop)` - Query fixed range
- `queryAt(sb, price, tolerance)` - Query exact price with tolerance
- `queryProximityCached(sb, cache, refPrice, pct, duration)` - Cached query
Removing & Updating
- `remove(sb, itemIndex)` - Remove item
- `update(sb, itemIndex, newPrice)` - Update item price
- `updateRange(sb, itemIndex, newBottom, newTop)` - Update item range
- `reindexAfterRemoval(sb, removedIndex)` - Reindex after single removal
- `reindexAfterBatchRemoval(sb, removedIndices)` - Batch reindex
- `clear(sb)` - Remove all items
Utilities
- `size(sb)` - Get item count
- `isEmpty(sb)` - Check if empty
- `contains(sb, itemIndex)` - Check if item exists
- `getStats(sb)` - Get debug statistics string
- `calculateOptimalBucketSize(price, pct)` - Calculate optimal bucket size
- `sortIndicesDescending(result)` - Sort for safe removal
- `sortIndicesAscending(result)` - Sort ascending
Performance Characteristics
Time Complexity
- Add : O(1) for single point, O(m) for range spanning m buckets
- Remove : O(1) lookup + O(b) bucket cleanup where b = buckets item spans
- Query : O(k) where k = buckets in range (typically 3-5) vs O(n) linear scan
- Update : O(1) removal + O(1) addition = O(1) total
Space Complexity
- Memory per item : ~8 bytes for index reference + map overhead
- Bucket overhead : Proportional to price range coverage
- Typical usage : For 500 items with 50 active buckets ≈ 4-8KB total
Scalability
- ✅ 100 items : ~5-10x faster than linear scan
- ✅ 500 items : ~10-15x faster
- ✅ 1000+ items : ~15-20x faster
- ⚠️ Performance degrades if bucket size is too small (too many buckets)
- ⚠️ Performance degrades if bucket size is too large (too many items per bucket)
Best Practices
Bucket Size Selection
1. Start with 2-5% of asset price for percentage-based queries
2. Use ATR-based mode for volatile assets or multi-symbol scripts
3. Test bucket size using `calculateOptimalBucketSize()` function
4. Monitor with `getStats()` to ensure reasonable bucket count
Memory Management
1. Clear old items regularly to prevent unbounded growth
2. Use age tracking to remove stale data
3. Set maximum item limits based on your needs
4. Batch removals are more efficient than individual removals
Query Optimization
1. Use caching for repeated queries within same bar
2. Invalidate cache when index changes significantly
3. Sort results descending before removal iteration
4. Batch operations when possible (reindexing, removal)
Data Consistency
1. Always reindex after removal to maintain index alignment
2. Remove from arrays in descending order to avoid index shifting issues
3. Use batch reindex for multiple simultaneous removals
4. Keep external arrays and index in sync at all times
Limitations & Caveats
Known Limitations
- Not suitable for exact price matching : Use tolerance with `queryAt()`
- Bucket size affects performance : Too small = many buckets, too large = many items per bucket
- Memory usage : Scales with price range coverage and item count
- Reindexing overhead : Removing items mid-array requires index shifting
When NOT to Use
- ❌ Datasets with < 50 items (linear scan is simpler)
- ❌ Items that change price every bar (constant reindexing overhead)
- ❌ When you need ALL items every time (no benefit over arrays)
- ❌ Exact price level matching without tolerance (use maps instead)
When TO Use
- ✅ Large datasets (100+ items) with occasional queries
- ✅ Proximity-based filtering (% of price, ATR-based ranges)
- ✅ Multi-timeframe level tracking
- ✅ Zone/range overlap detection
- ✅ Price-based spatial filtering
---
Technical Details
Bucketing Algorithm
Items are assigned to buckets using integer division:
```
bucketKey = floor((price - basePrice) / bucketSize)
```
For ATR-based mode:
```
effectiveBucketSize = atrValue × atrMultiplier
bucketKey = floor((price - basePrice) / effectiveBucketSize)
```
Range Indexing
Items spanning price ranges are indexed in all overlapping buckets to ensure accurate range queries. The midpoint bucket is designated as the "primary bucket" for removal operations.
Index Consistency
The library maintains two maps:
1. `buckets`: Maps bucket keys → IntArray wrappers containing item indices
2. `itemToBucket`: Maps item indices → primary bucket key (for O(1) removal)
This dual-mapping ensures both fast queries and fast removal while maintaining consistency.
Implementation Note: Pine Script doesn't allow nested collections (map containing arrays directly), so the library uses an `IntArray` wrapper type to hold arrays within the map structure. This is an internal implementation detail that doesn't affect usage.
---
Version History
Version 1.0
- Initial release
Credits & License
License : Mozilla Public License 2.0 (TradingView default)
Library Type : Open-source educational resource
This library is designed as a public domain utility for the Pine Script community. As per TradingView library rules, this code can be freely reused by other authors. If you use this library in your scripts, please provide appropriate credit as required by House Rules.
Summary
SpatialIndex is a specialized library that solves a specific problem: fast proximity queries on large price-based datasets . If you're building indicators that track hundreds of levels, zones, or price points and need to frequently filter by proximity to current price, this library can provide 10-20x performance improvements over naive linear scanning.
The index-based architecture makes it universally applicable to any data type, and the ATR-based bucketing ensures it adapts to market conditions automatically. Combined with query caching and batch operations, it provides a complete solution for spatial data management in Pine Script.
Use this library when speed matters and your dataset is large.

Breaker Blocks Finder | Gold | ProjectSyndicateProjectSyndicate Breaker Blocks Finder
📊 Overview
The ProjectSyndicate Breaker Blocks Finder (PS BB Finder) is a professional-grade Pine Script indicator designed to detect and display Bullish and Bearish Breaker Blocks based on Smart Money Concepts (SMC) methodology. This indicator is specifically optimized for XAUUSD (Gold) trading but works reliably across all symbols and timeframes.
Key Features
✅ Non-Repainting: Breaker blocks never change position after formation
✅ Multi-Timeframe Support: Optimized for M5, M10, M15, M20, M30, and H1
✅ Highly Customizable: 10+ user-configurable settings
✅ Visual Clarity: Color-coded boxes and labels for easy identification
✅ Performance Optimized: Handles 1000+ candles without lag
✅ Cross-Symbol Compatible: Works on Forex, Crypto, Stocks, Indices, and Commodities
✅ Displacement Detection: Uses ATR-based displacement to filter false signals
🎯 What are Breaker Blocks?
A Breaker Block is a failed order block that becomes a new support or resistance zone after being invalidated by price. It represents a market structure shift where institutional traders (smart money) have flipped their position.
Bullish Breaker Block
A Bullish Breaker Block forms when:
1 A bearish order block (resistance zone) exists
2 Price breaks ABOVE this zone with strong displacement
3 The former resistance zone now becomes SUPPORT
4 Price may retest this zone before continuing higher
Visual: Green box with "BB ▲" label
Bearish Breaker Block
A Bearish Breaker Block forms when:
5 A bullish order block (support zone) exists
6 Price breaks BELOW this zone with strong displacement
7 The former support zone now becomes RESISTANCE
8 Price may retest this zone before continuing lower
Visual: Red box with "BB ▼" label
⚙️ Default Settings
Setting Default Range Description
Lookback Period 1000 100-5000 Number of historical candles to analyze
Max Breaker Blocks 5 1-50 Maximum number of breaker blocks to display
Swing Detection Length 10 2-20 Bars on each side to confirm swing high/low. Higher = more significant swings
Use Displacement Filter true true/false Enable to filter breaker blocks by displacement size
Displacement Multiplier 2.0 0.5-5.0 Minimum move size as multiple of ATR. Higher = stricter detection
Invalidation Method Close Close/Wick Close = Conservative (candle must close beyond zone)Wick = Aggressive (wick touch is enough)
📈 Recommended Timeframes & Settings
This indicator is optimized for the following timeframes. Use these settings as a starting point.
Lower Timeframes (M5, M10, M15, M20)
These settings are designed to capture faster price movements and are the default settings for the indicator.
Setting Recommended Value
Lookback Period 1000
Max Breaker Blocks 5
Swing Detection Length 10
Use Displacement Filter true
Displacement Multiplier 2.0
Invalidation Method Close
Higher Timeframes (M30, H1)
For these timeframes, a less strict displacement filter is recommended to capture more significant, but less frequent, breaker blocks.
Setting Recommended Value
Lookback Period 1000
Max Breaker Blocks 5
Swing Detection Length 10
Use Displacement Filter true
Displacement Multiplier 1.0
Invalidation Method Close
🎓 How to Use
Step 1: Identify Breaker Blocks
Once the indicator is loaded, breaker blocks will automatically appear on your chart:
• Green boxes = Bullish breaker blocks (former resistance, now support)
• Red boxes = Bearish breaker blocks (former support, now resistance)
Step 2: Wait for Retest
The most reliable trading opportunities occur when price retests the breaker block zone:
• For bullish breaker blocks, wait for price to come back down to the green zone
• For bearish breaker blocks, wait for price to come back up to the red zone
Step 3: Look for Confluence
Combine breaker blocks with other SMC concepts for higher probability setups:
• Fair Value Gaps (FVG) within the breaker block zone
• Liquidity grabs before the retest
• Break of Structure (BoS) or Change of Character (ChoCH) confirmation
Step 4: Enter the Trade
Bullish Setup:
• Entry: At or near the bullish breaker block zone
• Stop Loss: Below the breaker block
• Take Profit: Previous swing high or higher
Bearish Setup:
• Entry: At or near the bearish breaker block zone
• Stop Loss: Above the breaker block
• Take Profit: Previous swing low or lower
🛡️ Non-Repainting Guarantee
This indicator is 100% non-repainting, meaning:
✅ Breaker blocks never change position after formation
✅ Historical breaker blocks remain in the exact same location indefinitely
✅ Backtesting results are reliable and consistent
🐛 Troubleshooting
Issue: No Breaker Blocks Appearing
Solutions:
• Ensure "Use Displacement Filter" is enabled.
• On M30/H1, try lowering the "Displacement Multiplier" to 1.0.
• Scroll back in history; blocks may not be present on the most recent bars.
Issue: Too Many Breaker Blocks
Solutions:
• Increase "Displacement Multiplier" to 2.5 or 3.0.
• Increase "Swing Detection Length" to 12-15.
• Decrease "Max Breaker Blocks" to 3-4.

Price Action Assistant V2All in One Assistant for Price Action Traders
1-Calculates and Displays the Opening Gap Relative to ADR.
2-Information Table Showing Yesterday’s and Today’s Range Plus Average Bar Range.
3-Displays Micro-Gaps (Fair Value Gaps).
4-Advanced Bar Numbering With an Option to Display at Custom Intervals, Using 9 or 12 Bar Color Multiples to Visualize the Closure of 45-Minute or 60-Minute Candles on an M5 Chart.
5-Plots Previous High, Low, and Close Levels Plus the Current Session Open.
6-Displays a 3-Bar Micro Channel in the Same Direction.
7-Includes Two Different Moving Averages.
8-Displays the Daily Date and Day-of-Week Label for Easy Journaling and Chart Archiving.

ICT Concepts [Kodexius]ICT Concepts is an all in one, chart overlay toolkit that combines several widely used ICT style components into a single, modular workflow. It is designed to help you map higher timeframe context, track directional structure, and refine execution areas with imbalance and liquidity concepts, without turning the chart into a cluttered drawing board.
Instead of plotting everything indefinitely, each module focuses on “live relevance” and chart readability. Zones, lines, and labels are managed with sensible limits so the most recent and most meaningful structures remain visible while older objects are automatically retired.
Because the system is modular, you can run it like a complete toolkit:
- Use multi timeframe Order Blocks to define high probability zones
- Use Market Structure (BOS and MSS) for bias and context
- Validate intent with SMT Divergence when you want intermarket confirmation
- Refine with Imbalances (FVG, BPR, CE) and Liquidity Sweeps
- Add timing structure via Killzones and risk structure via auto Fibonacci
🔹 Features
🔸 Multi Timeframe Order Blocks (3 candle displacement OB)
The OB engine detects a strict 3 candle displacement sequence (bull and bear) and projects the “order block candle” as a forward extending zone. Detection can run on the chart timeframe or on a user selected higher timeframe and then be displayed on your execution chart.
🔸 Overlap Control
Before adding a new OB, the script checks overlap against existing zones of the same direction. If a new zone intersects an existing one, it is ignored to reduce redundant stacking in the same price area.
🔸 Automatic Extension and Mitigation for Order Blocks
OB zones extend forward on every bar and are removed once mitigation is confirmed. Mitigation is evaluated by close breaking decisively beyond the relevant boundary:
- Bullish OB mitigates when close prints below the OB bottom
- Bearish OB mitigates when close prints above the OB top
🔸 Market Structure (BOS and MSS)
Market Structure is built from swing pivots using a configurable pivot length. When price closes through the latest swing, the script prints a structure event:
BOS (Break of Structure) for continuation
MSS (Market Structure Shift) for a directional change
To keep the chart readable, older structure drawings are capped by history limits.
🔸 SMT Divergence with optional mini panel
SMT can compare the current instrument with a user selected symbol to highlight divergence at swing points. A divergence is flagged when one market makes a new swing extreme while the other fails to confirm.
Optional: a compact right side “compare symbol” candle panel can be enabled so you can visually confirm what the secondary market is doing without leaving the chart.
🔸 Imbalances: FVG, BPR, and CE modes
You can choose between three imbalance views depending on your style:
FVG mode: Fair Value Gaps are plotted as extending zones
CE mode: Consequent Encroachment is visualized using a midpoint line and a half zone fill
BPR mode: Balanced Price Range is formed when a new FVG overlaps an opposing FVG, producing a “balanced” region that often behaves differently than a standalone gap
🔸 Automatic extension, limits, and mitigation for imbalances
Imbalance objects extend forward until mitigated. Mitigation uses wick based logic:
Bullish imbalance mitigates when price wicks below the zone bottom
Bearish imbalance mitigates when price wicks above the zone top
The script also enforces per side limits and removes older items to keep performance stable.
🔸 Liquidity sweeps (buyside and sellside)
The liquidity module tracks swing highs and lows and marks sweep events when price runs the level and then closes back through it, which often behaves like a rejection signal. Sweeps are visualized with a level line plus a small sweep highlight box, with an optional history cap.
🔸 Auto anchored Fibonacci (EQ and OTE focus)
Fibonacci levels are automatically anchored using the most recent structure context so you do not need to manually re draw fibs every time the market evolves. EQ and OTE focused bands are plotted to support common premium discount style workflows, with optional extra levels if desired.
🔸 Killzones (session boxes with optional range tracking)
Asian, London Open, New York AM, and New York PM killzones can be displayed using UTC-5 session definitions. Session boxes dynamically expand as new highs and lows are formed during the session, and historical zones can be retained up to a user set count. Rendering is restricted to intraday timeframes up to 60 minutes for clean scaling and performance.
🔹 Calculations
1) Order Block detection (3 candle displacement)
The OB pattern is defined inside detectLogic() . The zone boundaries always come from candle (the middle candle of the 3 candle sequence).
detectLogic() =>
bool isBull = open > close and close > open and close > open and low < low and close > high
bool isBear = open < close and close < open and close < open and high > high and close < low
[isBull, high , low , time , isBear, high , low , time ]
Interpretation (bullish side):
Candle is bearish
Candle is bullish (the OB candle)
Current candle is bullish and closes above high
low undercuts low to form the sweep style condition
Bearish logic is the mirrored inverse.
2) Multi timeframe projection and duplicate control
If the timeframe input is set, detections are computed on that timeframe and projected onto the current chart using request.security . A last processed time check prevents duplicate prints.
=
request.security(syminfo.tickerid, i_tf, detectLogic())
var int lastBullTime = 0
var int lastBearTime = 0
if mtf_isBull and mtf_bullTime != lastBullTime
lastBullTime := mtf_bullTime
if mtf_isBear and mtf_bearTime != lastBearTime
lastBearTime := mtf_bearTime
3) OB overlap validation and mitigation
Overlap is checked before pushing a new zone, then zones are extended and removed once mitigated by close.
method hasOverlap(array OBs, float top, float bottom) =>
bool overlap = false
if OBs.size() > 0
for i = 0 to OBs.size() - 1
OB item = OBs.get(i)
if (top < item.top and top > item.bottom) or (bottom > item.bottom and bottom < item.top)
overlap := true
break
overlap
method isMitigated(OB this, float currentClose) =>
this.isBull ? (currentClose < this.bottom) : (currentClose > this.top)
4) Market Structure: pivots, BOS, and MSS
Swings are derived from pivots; then BOS/MSS prints when price crosses the latest swing. The script tracks trend state to decide whether the break is continuation (BOS) or shift (MSS).
float ph = ta.pivothigh(i_structLen, i_structLen)
float pl = ta.pivotlow(i_structLen, i_structLen)
bool brokenHigh = ta.crossover(close, lastHigh)
bool brokenLow = ta.crossunder(close, lastLow)
// drawStructure(..., "BOS", ...) or drawStructure(..., "MSS", ...) depending on trend state
5) SMT Divergence conditions
SMT uses pivot highs/lows on both instruments. A bearish SMT prints when the main chart makes a higher high but the compare symbol fails to exceed its prior high. A bullish SMT prints when the main chart makes a lower low but the compare symbol fails to make a lower low.
bool bearishSmt = not na(smtAHighPrev) and not na(smtBHighPrev) and (smtAHighLast > smtAHighPrev) and (smtBHighLast <= smtBHighPrev)
bool bullishSmt = not na(smtALowPrev) and not na(smtBLowPrev) and (smtALowLast < smtALowPrev) and (smtBLowLast >= smtBLowPrev)
6) FVG detection, BPR construction, and CE level
FVGs are detected via a classic 3 bar gap condition. When a new FVG overlaps an opposing FVG, the script builds a BPR using the intersecting region. CE is the midpoint (top + bottom) / 2, plotted as a dashed line plus a half fill box.
bool fvgBullDetected = low > high
bool fvgBearDetected = high < low
// CE
float ceLevel = (this.top + this.bottom) / 2
Imbalance mitigation uses wick logic:
method isMitigated(FVG this, float currentHigh, float currentLow) =>
this.isBull ? (currentLow < this.bottom) : (currentHigh > this.top)
7) Liquidity sweep trigger
A sweep is confirmed only when price runs the pivot level and closes back through it (reject style).
bool sweepBull = i_showLiq and not na(liqLastLow) and not liqLastLowSwept and low < liqLastLow and close > liqLastLow
bool sweepBear = i_showLiq and not na(liqLastHigh) and not liqLastHighSwept and high > liqLastHigh and close < liqLastHigh
8) Killzone session mapping
Sessions are defined in UTC-5 using time() session strings.
string kzTz = "UTC-5"
kzInSession(string sess) =>
not na(time(timeframe.period, sess, kzTz))
bool inAsian = kzInSession("2000-0000")
bool inLondon = kzInSession("0200-0500")
bool inNY = kzInSession("0830-1100")

Daytrading Suite: Neon TPO + FVG v6.1Here is the summary of the code and the trading guide in English.
---
### 1. Code Summary: What does the chart show?
The script combines three dimensions of trading into a single chart:
* **The Context (TPO / Market Profile - Yesterday):**
* **Gold Zone (Center):** Yesterday's **POC (Point of Control)**. This was the "fairest price". It often acts as a magnet.
* **White Dashed Lines:** The **VAH (Value Area High)** and **VAL (Value Area Low)**. Yesterday, 70% of all trading volume happened between these lines. This is the area of "Balance".
* **The Structure (HTF - 1 Hour+):**
* **Red/Green Boxes (Right Edge):** Automatic **Supply & Demand Zones** based on the 1-hour chart (or your setting). They indicate major resistance and support levels.
* **The Timing (Entries):**
* **Neon FVG Boxes (Small):** "Fair Value Gaps". These represent imbalances in price. If price revisits these, it is often your **entry signal**.
* **Lines (VWAP, EMA, PDH/PDL):** Act as dynamic support and trend indicators.
---
### 2. Trading Strategy: How to use it
Do not just trade every colored spot. You must combine **Location (TPO)** with **Signal (FVG)**.
#### Step A: The Open (Where are we?)
In the morning (or at the US Open), check where the price is relative to the **white TPO lines**.
1. **Inside the White Lines (In Balance):**
* The market is undecided. Expect ranging/choppy behavior.
* **Strategy:** Buy at the bottom edge (VAL), Sell at the top edge (VAH). The target is often the Gold Zone (POC) in the middle.
2. **Outside the White Lines (Imbalance):**
* The market is seeking new prices. Danger of a Trend!
* **Strategy:** If price breaks above VAH and tests it from above -> **Long**. If it breaks below VAL -> **Short**.
#### Step B: The Setup (The High Probability Scenario)
Here is the "Rejection" Setup (Long Example):
1. Price drops to the lower white line (**VAL**) or into a green **Demand Zone**.
2. It bounces (shows a wick).
3. In the process, a small **green Neon FVG** is formed.
4. **Entry:** Limit Order at the top of the Neon FVG.
5. **Target:** The Gold Zone (POC) or the upper white line (VAH).
6. **Stop Loss:** Below the recent swing low.
#### Step C: Warning Signals (When NOT to trade)
* **In "No Man's Land":** If the price is sitting right in the middle between Gold (POC) and White (VAH/VAL), do nothing. The risk is 50/50. Wait until price hits an edge.
* **Against the Flow:** If EMA 9 and 21 are pointing steeply downwards, do not buy blindly at the VAL just because the line is there. Wait for confirmation (FVG).
### Pre-Trade Checklist:
1. **Level:** Am I at a white line (VAH/VAL) or the Gold Zone (POC)?
2. **Structure:** Do I have an HTF Demand/Supply Zone backing me up?
3. **Trigger:** Do I see a Neon FVG pointing in my direction?

Smart Money Concept Change of Character Break of StructureSMC Structure
Visualizes Change of Character (CHoCH) and Break of Structure (BoS) - two fundamental Smart Money Concepts for identifying trend reversals and continuations.
This is the 1st version of an implementation of this concept.
It is NOT supposed to be used as a signal but a confirmation. Best use during NYSE hours.
Full Description
Overview
This indicator automatically detects and displays two core Smart Money Concepts (SMC) directly on your chart:
CHoCH (Change of Character) – The first structural break against the prevailing trend, signaling a potential reversal
BoS (Break of Structure) – A structural break in the direction of the current trend, confirming continuation
These concepts are essential building blocks of SMC trading methodology, helping traders identify where institutional players may be entering or exiting positions.
How It Works
The indicator uses pivot-based swing detection to identify significant highs and lows. When price breaks through these levels, it classifies the move as either a CHoCH or BoS based on the current trend context.
CHoCH (Change of Character)
Occurs when price breaks structure AGAINST the current trend
First warning sign that the trend may be reversing
Displayed as a solid horizontal line with "CHoCH" label
Green = Bullish reversal | Red = Bearish reversal
BoS (Break of Structure)
Occurs when price breaks structure IN THE DIRECTION of the current trend
Confirms that the existing trend remains intact
Displayed as a dashed horizontal line with "BoS" label
Teal = Bullish continuation | Maroon = Bearish continuation
Visual Example
Uptrend with BoS (continuation):
HH ◄── BoS (trend continues)
/
HL
/
HH
/
HL
Uptrend → CHoCH → Downtrend (reversal):
HH
/ \
HL \
LL ◄── CHoCH (trend reversal!)
Settings
Pivot Settings
Pivot Lookback: Number of bars used to identify swing highs/lows (default: 5). Higher values = fewer but more significant structure points.
Display Options
Show CHoCH: Toggle CHoCH visualization
Show BoS: Toggle BoS visualization
Show Swing Points: Display SH/SL labels at detected pivots
Extend Lines to Right: Extend structure lines into future bars
Show Info Table: Display current trend and last swing levels
Show Trend Background: Color the chart background based on trend direction
Colors
Fully customizable colors for all elements
How to Use
Identify the trend: Look at the sequence of CHoCH and BoS signals to understand market structure
Watch for CHoCH: A CHoCH signals potential reversal – wait for confirmation before trading against the previous trend
Trade with BoS: BoS confirms trend continuation – look for entries on pullbacks in the direction of the trend
Combine with other SMC concepts: Works great alongside Order Blocks, Fair Value Gaps, and liquidity concepts
Tips
Use higher pivot lookback values on higher timeframes for cleaner signals
A CHoCH doesn't guarantee reversal – it's the first warning sign, not confirmation
Multiple BoS signals in a row indicate a strong, healthy trend
Look for CHoCH occurring at key levels (support/resistance, order blocks) for higher probability setups
Feedback Welcome!
This is an open-source indicator and I'd love to hear your thoughts!
Please comment below if you have:
Feature requests or ideas for improvements
Bug reports or issues
Suggestions for additional SMC concepts to add
Your feedback helps make this indicator better for everyone. Happy trading! 🚀

FVG Heatmap [Hash Capital Research]FVG Map
FVG Map is a visual Fair Value Gap (FVG) mapping tool built to make displacement imbalances easy to see and manage in real time. It detects 3-candle FVG zones, plots them as clean heatmap boxes, tracks partial mitigation (how much of the zone has been filled), and summarizes recent “fill speed” behavior in a small regime dashboard.
This is an indicator (not a strategy). It does not place trades and it does not publish performance claims. It is a market-structure visualization tool intended to support discretionary or systematic workflows.
What this script detects
Bullish FVG (gap below price)
A bullish FVG is detected when the candle from two bars ago has a high below the current candle’s low.
The zone spans from that prior high up to the current low.
Bearish FVG (gap above price)
A bearish FVG is detected when the candle from two bars ago has a low above the current candle’s high.
The zone spans from the current high up to that prior low.
What makes it useful
Heatmap zones (clean, readable FVG boxes)
Bullish zones plot below price. Bearish zones plot above price.
Partial fill tracking (mitigation progress)
As price trades back into a zone, the script visually shows how much of the zone has been filled.
Mitigation modes (your definition of “filled”)
• Full Fill: price fully trades through the zone
• 50% Fill: price reaches the midpoint of the zone
• First Touch: price touches the zone one time
Optional auto-cleanup
Optionally remove zones once they’re mitigated to keep the chart clean.
Fill-Speed Regime Dashboard
When zones get mitigated, the script records how many bars it took to fill and summarizes the recent environment:
• Average fill time
• Median fill time
• % fast fills vs % slow fills
• Regime label: choppy/mean-revert, trending/displacement, or mixed
How to use
Use FVG zones as structure, not guaranteed signals.
• Bullish zones are often watched as potential support on pullbacks.
• Bearish zones are often watched as potential resistance on rallies.
The fill-speed dashboard helps provide context: fast fills tend to appear in more rotational conditions, while slow fills tend to appear in stronger trend/displacement conditions.
Alerts
Bullish FVG Created
Bearish FVG Created
Notes
FVGs are not guaranteed reversal points. Fill-speed/regime is descriptive of recent behavior and should be treated as context, not prediction. On realtime candles, visuals may update as the bar forms.

FVG Supply and DemandThis indicator combines powerful tools into one:
• Supply & Demand Zones built from swing highs/lows with ATR-based zone width, POI markers, and Break-of-Structure (BOS) detection.
• Volumized Fair Value Gaps (FVGs) showing bullish/bearish gaps, total volume inside the gap, volume distribution, optional zone-combining, and auto-cleanup.
• Swing TSL Line and manage bar color.
It helps visualize key imbalance areas, institutional zones, and price reaction points.
Credits to the Author.
⚠️ Disclaimer
This indicator is provided for educational and analytical purposes only.
It does not provide trading advice.
Past results do not guarantee future outcomes.
Use responsibly and in conjunction with your market analysis.

Market Maker Position Bars (Position Size)**Market Maker Position Bars (Position Size) – Indicator Description for TradingView**
This indicator is a clean, professional visualization tool designed for traders who track suspected **market maker / institutional positioning** (especially popular in ICT/SMC communities) on indices like the SPX, NDX, ES, etc.
It draws up to **20 horizontal position bars** directly on the chart, anchored to the very last bar, representing hypothetical long and short positions at specific price levels with corresponding position sizes.
### Key Features & Visual Logic
- **Green bars (Boxes 1–10)** → Extend to the **right** of the last bar
Represent **long positions** (bullish interest)
Default translucent green fill
- **Red bars (Boxes 11–20)** → Extend to the **left** of the last bar
Represent **short positions** (bearish interest)
Default translucent red fill
- **Bar width = Position size**
The length of each box is automatically scaled based on the absolute value you enter in “Position Size”.
Larger position → wider (longer) bar
- Each box displays **Price / Position Size** text inside (e.g., `5720.50 / 1250`)
### Fully Customizable Settings
**Global Geometry**
- Total Box Height (default 10.0) – controls vertical thickness of all boxes
**Position Size Scaling**
- Base Box Width (bars)
- Width per Position Unit – fine-tune how aggressively width grows with size
- Minimum & Maximum Bar Width – prevents boxes from becoming too tiny or excessively long
**Global Text Settings**
- Text color, size (Tiny → Huge), and bold option
**Individual Box Controls (20 independent boxes)**
- Show/Hide toggle
- SPX Price (or any symbol price level)
- Position Size (any positive/negative number; absolute value determines width)
- Fill color (override default green/red if desired)
### How It Works Internally
- All boxes are drawn only on the **last confirmed bar** (`barstate.islast`)
- Width calculation:
`Width = BaseWidth + (|Position Size| × Width per Unit)`
Clamped between Min and Max Bar Width
- Green boxes start at the current bar and extend forward (right)
- Red boxes end at the current bar and extend backward (left)
- Uses Pine Script v6 `box.new()` with `xloc.bar_index` for perfect alignment and performance
### Ideal Use Cases
- Visualizing daily/weekly **order block** or **fair value gap** interest levels with estimated size
- Mapping **dealer positioning**, gamma exposure levels, or large options interest
- Quickly seeing where the “smart money” is theoretically stacked on both sides of the market
- Clean chart markup for screenshots, mentoring, or live trading journals
A minimalist yet powerful tool favored by ICT, SMC, and footprint-style traders who want to see **where the big players might be positioned** — all in one glance without cluttering the chart with hundreds of objects.
Clean. Visual. Size-aware. Perfect for high-level market profiling.

HTF FVG + SessionsThis indicator combines multi-timeframe FVG A–C detection with intraday session boxes on a single chart.
It automatically finds bullish and bearish Fair Value Gaps on 15m, 30m, 1H, 4H, 1D and 1W timeframes.
Fresh FVGs are drawn in a transparent gold color, then dynamically shrink as price trades back into the gap.
Once price fully fills the gap, the FVG box and its label are automatically removed from the chart.
After the first touch, each FVG changes to a per-timeframe gray shade, making overlapping HTF gaps easy to see.
You can toggle each timeframe on/off and also globally enable/disable all FVGs from the settings panel.
Session boxes highlight Asia, London, NY AM, NY Lunch and NY PM using soft colored rectangles.
Each session box is plotted from the high to the low of that session and labeled with its name in white text.
A global “Show all session boxes” switch allows you to quickly hide or display the session structure.
This tool is designed for traders who want to combine FVG liquidity maps with clear intraday session context.

Stratégie SMC V18.2 (BTC/EUR FINAL R3 - Tendance)This strategy is an automated implementation of Smart Money Concepts (SMC), designed to operate on the Bitcoin/Euro (BTC/EUR) chart using the 15-minute Timeframe (M15).It focuses on identifying high-probability zones (Order Blocks) after a confirmed Break of Structure (BOS) and a Liquidity Sweep, utilizing an H1/EMA 200 trend filter to only execute trades in the direction of the dominant market flow.Risk management is strict: every trade uses a fixed Risk-to-Reward Ratio (R:R) of 1:3.🧱 Core Logic Components
1. Trend Filter (H1/EMA 200)Objective: To avoid counter-trend entries, which has allowed the success rate to increase to nearly $65\%$ in backtests.Mechanism: A $200$-period EMA is plotted on a higher timeframe (Default: H1/60 minutes).Long (Buy): Entry is only permitted if the current price (M15) is above the trend EMA.Short (Sell): Entry is only permitted if the current price (M15) is below the trend EMA.
2. Order Block (OB) DetectionA potential Order Block is identified on the previous candle if it is
accompanied by an inefficiency (FVG - Fair Value Gap).
3. Advanced SMC ValidationBOS (Break of Structure): A recent BOS must be confirmed by breaking the swing high/low defined by the swing length (Default: 4 M15 candles).Liquidity (Liquidity Sweep): The Order Block zone must have swept recent liquidity (defined by the Liquidity Search Length) within a certain tolerance (Default: $0.1\%$).Point of Interest: The OB must form in a premium zone (for shorts) or a discount zone (for longs) relative to the current swing range (above or below the $50\%$ level of the range).
4. Execution and Risk ManagementEntry: The trade is triggered when the price touches the active Order Block (mitigation).Stop Loss (SL): The SL is fixed at the low of the OB (for longs) or the high of the OB (for shorts).Take Profit (TP): The TP is strictly set at a level corresponding to 3 times the SL distance (R:R 1:3).Lot Sizing: The trade quantity is calculated to risk a fixed amount (Default: 2.00 Euros) per transaction, capped by a Lot Max and Lot Min defined by the user.
Input Parameters (Optimized for BTC/EUR M15)Users can adjust these parameters to modify sensitivity and risk profile. The default values are those optimized for the high-performing backtest (Profit Factor $> 3$).ParameterDescriptionDefault Value (M15)Long. Swing (BOS)Candle length used to define the swing (and thus the BOS).4Long. Recherche Liq.Number of candles to scan to confirm a liquidity sweep.7Tolérance Liq. (%)Price tolerance to validate the liquidity sweep (as a percentage of price).0.1Timeframe TendanceChart timeframe used for the EMA filter (e.g., 60 = H1).60 (H1)Longueur EMA TendancePeriods used for the trend EMA.200Lot Max (Quantité Max BTC)Maximum quantity of BTC the strategy is allowed to trade.0.01Lot Min Réel (Exigence Broker)Minimum quantity required by the broker/exchange.0.00001

Effort HeatmapThe Effort Heatmap visualizes where meaningful, same-direction volume occurred inside an imbalance during strong directional movement.
Instead of analyzing total bar volume or traditional volume-at-price distributions, this tool reconstructs a simplified internal volume profile using lower-timeframe data.
When a Fair Value Gap forms during a high-volume displacement, the script highlights the portions of the imbalance candle where directional effort was concentrated and projects those regions forward as a heatmap.
The purpose of this indicator is not to predict price or represent institutional activity, but to offer a visual way to study how the market delivered volume inside a move that created an imbalance.
How It Works
1. Lower-Timeframe Volume Extraction
The indicator retrieves open, close, and volume data from a selected lower timeframe.
Only sub-candles that move in the same direction as the previous bar are considered, ensuring the heatmap reflects directional effort—not mixed volume.
2. Candle Body Binning
The FVG candle is divided into multiple horizontal bins.
Each lower-timeframe sub-candle contributes volume proportionally to the bins it overlaps, creating a vertical volume distribution for that bar.
3. Imbalance (FVG) Detection
A simple 3-bar displacement logic detects bullish or bearish imbalances.
An optional Z-Score filter ensures the heatmap only forms when volume is relatively elevated compared to recent history.
4. Heatmap Projection
When a qualifying imbalance occurs:
• The FVG bar’s volume distribution is normalized
• Only areas with relatively elevated volume are displayed
• Colored heatmap boxes are created and extend forward
• These boxes remain until price trades into or through them
This allows traders to observe how price interacts with past zones of concentrated directional effort.
What Makes It Different
Most volume tools focus on fixed session profiles, market-wide volume-at-price calculations, or bar-level volume totals.
The Effort Heatmap instead reconstructs a per-bar vertical volume distribution using lower-timeframe price action and displays it only when displacement occurs.
Rather than treating the candle as a single block of volume, the indicator highlights where inside the candle body volume was delivered while moving in the displacement direction.
This creates a unique visualization of directional effort that conventional profiles, OB/FVG indicators, and classic oscillators do not show.
How to Use It
1. Apply to any timeframe: The indicator works on all chart timeframes, but gains more detail when higher timeframes are used in combination with lower-timeframe volume data.
2. Identify displacement moments: When a bullish or bearish FVG forms with a high volume Z-Score, the heatmap will appear.
3. Observe the heatmap structure:
Each horizontal band represents the relative concentration of same-direction volume inside the previous candle.
4. Watch how price interacts with these zones:
Heatmap areas extend until price touches or trades through them, at which point they stop extending and are finalized.
5. Combine with your own analysis:
These areas can be used to study...
...how past directional volume clusters influence current movement
...structural reactions to zones of prior effort
...which parts of a displacement candle were most active
The indicator is a visual study tool, not a signal generator.
Settings
• Volume Source Timeframe
Chooses the lower timeframe used to reconstruct internal volume. Smaller timeframes give more detail; larger timeframes give smoother profiles.
• Z-Score Lookback
Controls how many bars are used to measure relative volume. Larger values make the volume filter stricter.
• Z-Score Threshold
Minimum relative-volume strength required to draw a heatmap. Higher values show only high-effort moves.
• Volume Filter (%)
Removes weaker bins based on how much volume they contain compared to the strongest one. Higher percentages = fewer but more meaningful zones.
• Bullish / Bearish Colors
Sets the base color for heatmap boxes depending on direction.

Improved ICT MultiTF A+ IndicatorThis indicator provides ICT-style multi time frame fair value gaps with a 4-hour moving average bias. It prioritizes 15-minute gaps and falls back to 5-minute and 1-minute gaps when none are present. It also includes alert conditions for long and short signals based on session filters and bias.

WorldCup Dashboard + Institutional Sessions© 2025 NewMeta™ — Educational use only.
# Full, Premium Description
## WorldCup Dashboard + Institutional Sessions
**A trade-ready, intraday framework that combines market structure, real flow, and institutional timing.**
This toolkit fuses **Institutional Sessions** with a **price–volume decision engine** so you can see *who is active*, *where value sits*, and *whether the drive is real*. You get: **CVD/Delta**, volume-weighted **Momentum**, **Aggression** spikes, **FVG (MTF)** with nearest side, **Daily Volume Profile (VAH/POC/VAL)**, **ATR regime**, a **24h position gauge**, classic **candle patterns**, IBH/IBL + **first-hour “true close”** lines, and a **10-vote confluence scoreboard**—all in one view.
---
## What’s inside (and how to trade it)
### 🌍 Institutional Sessions (Sydney • Tokyo • London • New York)
* Session boxes + a highlighted **first hour**.
* Plots the **true close** (first-hour close) as a running line with a label.
**Use:** Many desks anchor risk to this print. Above = bullish bias; below = bearish. **IBH/IBL** breaks during London/NY carry the most signal.
### 📊 CVD / Delta (Flow)
* Net buyer vs seller pressure with smooth trend state.
**Use:** **Rising CVD + acceptance above mid/POC** confirms continuation. Bearish price + rising CVD = caution (possible absorption).
### ⚡ Volume-Weighted Momentum
* Momentum adjusted by participation quality (volume).
**Use:** Momentum>MA and >0 → trend drive is “real”; <0 and falling → distribution risk.
### 🔥 Aggression Detector
* ROC × normalized volume × wick factor to flag **forceful** candles.
**Use:** On spikes, avoid fading blindly—wait for pullbacks into **aligned FVG** or for aggression to cool.
### 🟦🟪 Fair Value Gaps (with MTF)
* Detects up to 3 recent FVGs and marks the **nearest** side to price.
**Use:** Trend pullbacks into **bullish FVG** for longs; bounces into **bearish FVG** for shorts. Optional threshold to filter weak gaps.
### 🧭 24h Gauge (positioning)
* Shows current price across the 24h low⇢high with a mid reference.
**Use:** Above mid and pushing upper third = momentum continuation setups; below mid = sell the rips bias.
### 🧱 Daily Volume Profile (manual per day)
* **VAH / POC / VAL** derived from discretized rows.
**Use:** **POC below** supports longs; **POC above** caps rallies. Fade VAH/VAL in ranges; treat them as break/hold levels in trends.
### 📈 ATR Regime
* **ATR vs ATR-avg** with direction and regime flag (**HIGH / NORMAL / LOW**).
**Use:** HIGH ⇒ give trades room & favor trend following. LOW ⇒ fade edges, scale targets.
### 🕯️ Candle Patterns (contextual, not standalone)
* Engulfings, Morning/Evening Star, 3 Soldiers/Crows, Harami, Hammer/Shooting Star, Double Top/Bottom.
**Use:** Only with session + flow + momentum alignment.
### 🤝 Price–Volume Classification
* Labels each bar as **continuation**, **exhaustion**, **distribution**, or **healthy pullback**.
**Use:** Align continuation reads with trend; treat “Price↑ + Vol↓” as a caution flag.
### 🧪 Confluence Scoreboard & B/S Meter
* Ten elements vote: 🔵 bull, ⚪ neutral, 🟣 bear.
**Use:** Execution filter—take setups when the board’s skew matches your trade direction.
---
## Playbooks (actionable)
**Trend Pullback (Long)**
1. London/NY active, Momentum↑, CVD↑, price above 24h mid & POC.
2. Pullback into **nearest bullish FVG**.
3. Invalidate under FVG low or **true-close** line.
4. Targets: IBH → VAH → 24h high.
**Range Fade (Short)**
1. Asia/quiet regime, **Price↑ + Vol↓** into **VAH**, ATR low.
2. Nearest FVG bearish or scoreboard skew bearish.
3. Invalidate above VAH/IBH.
4. Targets: POC → VAL.
**News/Impulse**
Aggression spike? Don’t chase. Let it pull back into the aligned FVG; require CVD/Momentum agreement before entry.
---
## Alerts (included)
* **Bull/Bear Confluence ≥ 7/10**
* **Intraday Target Achieved** / **Daily Target Achieved**
* **Session True-Close Retests** (Sydney/Tokyo/London/NY)
*(Keep alerts “Once per bar” unless you specifically want intrabar triggers.)*
---
## Setup Tips
* **UTC**: Choose the reference that matches how you track sessions (default UTC+2).
* **Volume threshold**: 2.0× is a strong baseline; raise for noisy alts, lower for majors.
* **CVD smoothing**: 14–24 for scalps; 24–34 for slower markets.
* **ATR lengths**: Keep defaults unless your asset has a persistent regime shift.
---
## Why this framework?
Because **timing (sessions)**, **truth (flow)**, and **location (value/FVG)** together beat any single signal. You get *who is trading*, *how strong the push is*, and *where risk lives*—on one screen—so execution is faster and cleaner.
---
**Disclaimer**: Educational use only. Not financial advice. Markets are risky—backtest and size responsibly.

ICT Levels Breach Scanner (12M Timeframe)Detects and scans for breaches of key Inner Circle Trader (ICT) concepts on the yearly (12M) chart: Swing Lows (3-bar wick pivots), Rejection Blocks (3-bar body pivots), Fair Value Gaps (3-bar inefficiencies), and Volume Imbalances (bullish body gaps ≥0.15%, unmitigated).
Features:
Tracks active levels with arrays for real-time breach detection (price low below any level triggers alert).
Visuals: Blue solid lines (Swing Lows), orange dashed (Rejection Blocks), purple dotted (FVGs), green boxes (VIs)—all extending right.
Red triangle + bgcolor alert on breach bar; built-in alertcondition for notifications.
Optimized for Pine Screener: Filter stocks (e.g., US exchanges) showing symbols where price has traded below these levels on the latest 12M bar.
Usage: Apply to a 12M chart for viz, or add to Screener > Pine tab for multi-symbol scans. Customize gap % or add bearish variants via inputs. Ideal for spotting potential support in long-term trends.
ICT-inspired; test on liquid stocks like AAPL/TSLA. Not financial advice.

Price Trendlines + Break Signals█ OVERVIEW
The "Price Trendlines + Break Signals" indicator is a technical analysis tool that automatically draws trendlines based on price pivot points and detects breakout signals. Designed for traders seeking precise market signals, the indicator identifies key pivot points, draws trendlines (resistance and support), and generates breakout signals with background highlighting. It offers flexible settings and alerts for breakout signals.
█ CONCEPTS
The indicator was created to provide traders with an alternative source of signals based on trendlines. Breakouts and bounces from trendlines can signal a trend change or the end of a correction. Combining these signals with other technical analysis tools can form the basis for building diverse trading strategies.
█ FEATURES
-Pivot Point Calculation: The indicator identifies pivot points (pivot high and pivot low) based on the closing price, with configurable left and right bars for pivot detection. Setting a higher number of bars results in fewer but more significant trendlines, with a delay corresponding to the specified length. Lower values generate more trendlines, but they are less significant. Crossovers are signaled only after the trendline is drawn, so sometimes no signals appear on crossed trendlines—this indicates the price passed through the line before it was detected.
- Trendlines: Draws trendlines connecting price pivot points—upper lines for downtrends (resistance) and lower lines for uptrends (support). Lines can be extended by a specified number of bars (default: 50).
- Tolerance Margin: Trendlines are widened by a tolerance margin, calculated using the average candle body size over a specified period and its multiplier. Reducing the multiplier to zero leaves only the trendline without a margin. Breaking this zone is a condition for generating signals.
- Breakout Signals: Generates signals when the price breaks through a trendline (bullish for upper lines, bearish for lower lines), with background highlighting for signal confirmation.
Alerts: Built-in alerts for:
- Upper trendline breakout (bullish signal).
- Lower trendline breakout (bearish signal).
Customization: Allows adjustment of pivot parameters, trendline extension length, tolerance margin, line colors, fills, and signal background transparency.
█ HOW TO USE
Adding the Indicator: Add the indicator to your TradingView chart via the Pine Editor or Indicators menu.
Configuring Settings:
- Left Bars for Pivot: Number of bars back for detecting pivots (default: 10).
- Right Bars for Pivot: Number of bars forward to confirm pivots (default: 10).
- Extend past 2nd pivot: Number of bars to extend the trendline after the second pivot (default: 50, 0 = no extension).
- Average Body Periods: Period for calculating the average candle body size used for the tolerance margin (default: 100).
- Tolerance Multiplier: Multiplier for the tolerance margin based on the average candle body size (default: 1.0).
Colors and Style:
- Upper trendline (resistance): default red.
- Lower trendline (support): default green.
- Line fills: colors with transparency (default 70).
- Signal background: green for bullish signals, red for bearish signals (default transparency 85).
Interpreting Signals:
- Trendlines: Upper lines (red) indicate a downtrend, lower lines (green) indicate an uptrend. Signals appear after a trendline breakout with the tolerance margin. Each trendline generates only one breakout signal, though it may still act as resistance or support for the price.
- Breakout Signals: Green background indicates an upper trendline breakout (bullish), red background indicates a lower trendline breakout (bearish).
- Alerts: Set up alerts in TradingView for trendline breakout signals.
Combining with Other Tools: Use with support/resistance levels, Fibonacci levels, RSI, pivot points, or FVG (Fair Value Gap) for signal confirmation.
█ APPLICATIONS
The "Price Trendlines + Break Signals" indicator is designed to identify trends and potential reversal points, supporting both trend-following and contrarian strategies:
- Trend Confirmation: Trendlines indicate the direction of the price trend, and bounces from them may signal the end of a correction.
- Reversal Strategies: Breakout signals can be used as cues to enter positions in anticipation of a trend change or correction.
- Noise Filtering: The tolerance margin reduces false signals, enhancing reliability.
█ NOTES
- Trendline crossovers are signaled only after the trendline is drawn, so sometimes no signals appear on crossed trendlines—this indicates the price passed through the line before it was detected.
- Each trendline generates only one breakout signal, though it may still act as a level of support or resistance for the price.
- Setting a higher number of bars for pivots results in fewer but more significant trendlines, with a delay corresponding to the specified length. Lower values generate more trendlines, but they are less significant.
- Adjust settings (e.g., number of bars for pivots, tolerance multiplier) to suit your trading style and timeframe.
- Combine with other technical analysis tools, such as RSI, pivot points, or FVG, to enhance signal accuracy.
- For high-volatility markets, consider increasing the tolerance margin to reduce false signals.

Ayman Entry Signal – Ultimate PRO (Scalping Gold Settings)1. Overview
This indicator is a professional gold scalping tool built for TradingView using Pine Script v6.
It combines multiple price action and technical filters to generate high-probability Buy/Sell signals with built-in trade management features (TP1, TP2, SL, Break Even, Partial Close, Stats tracking).
It is optimized for XAUUSD but can be applied to other assets with proper setting adjustments.
2. Key Features
Multi-Condition Trade Signals – EMA trend, Break of Structure, Order Blocks, FVG, Liquidity Sweeps, Pin Bars, Higher Timeframe confirmation, Trend Cloud, SMA Cross, and ADX.
Full Trade Management – Auto-calculates lot size, SL, TP1, TP2, Break Even, Partial Close.
Dynamic Chart Drawing – Entry lines, SL/TP lines, trade boxes, and real-time PnL.
Statistics Panel – Tracks wins, losses, breakeven trades, and total PnL over selected dates.
Customizable Filters – All filters can be turned ON/OFF to match your strategy.
3. Main Inputs & Settings
Account Settings
Capital ($) – Total trading capital.
Risk Percentage (%) – Risk per trade.
TP to SL Ratio – Risk-to-reward ratio.
Value Per Point ($) – Value per pip/point for lot size calculation.
SL Buffer – Extra points added to SL to avoid stop hunts.
Take Profit Settings
TP1 % of Full Target – Fraction of TP1 compared to TP2.
Move SL to Entry after TP1? – Activates Break Even after TP1.
Break Even Buffer – Extra points when moving SL to BE.
Take Partial Close at TP1 – Option to close half at TP1.
Signal Filters
ATR Period – For SL/TP calculation buffer.
EMA Trend – Uses EMA 9/21 crossover for trend.
Break of Structure (BoS) – Requires structure break confirmation.
Order Block (OB) – Validates trades within OB zones.
Fair Value Gap (FVG) – Confirms trades inside FVGs.
Liquidity Sweep – Checks if liquidity zones are swept.
Pin Bar Confirmation – Uses candlestick patterns for extra confirmation.
Pin Bar Body Ratio – Controls strictness of Pin Bar filter.
Higher Timeframe Filters (HTF)
HTF EMA Confirmation – Confirms lower timeframe trades with higher timeframe trend.
HTF BoS – Confirms with higher timeframe structure break.
HTF Timeframe – Selects higher timeframe.
Advanced Filters
SuperTrend Filter – Confirms trades based on SuperTrend.
ADX Filter – Filters out low volatility periods.
SMA Cross Filter – Uses SMA 8/9 cross as filter.
Trend Cloud Filter – Uses EMA 50/200 as a cloud trend filter.
4. How It Works
Buy Signal Conditions
EMA 9 > EMA 21 (trend bullish)
Optional filters (BoS, OB, FVG, Liquidity Sweep, Pin Bar, HTF confirmations, ADX, SMA Cross, Trend Cloud) must pass if enabled.
When all active filters pass → Buy signal triggers.
Sell Signal Conditions
EMA 9 < EMA 21 (trend bearish)
Same filtering process but for bearish conditions.
When all active filters pass → Sell signal triggers.
5. Trade Execution & Management
When a signal triggers:
Lot size is auto-calculated based on risk % and SL distance.
SL is placed beyond recent swing high/low + ATR buffer.
TP1 and TP2 are calculated from the SL using the reward-to-risk ratio.
Break Even: If enabled, SL moves to entry price after TP1 is hit.
Partial Close: If enabled, half of the position closes at TP1.
Trade Exit: Full exit at TP2, SL hit, or partial close at TP1.
6. Chart Display
Entry Line – Shows entry price.
SL Line – Red dashed line at stop loss level.
TP1 Line – Lime dashed line for TP1.
TP2 Line – Green dashed line for TP2.
PnL Labels – Displays real-time profit/loss in $.
Trade Box – Visual area showing trade range.
Pin Bar Shapes – Optional, marks Pin Bars.
7. Statistics Panel
Stats Header – Shows “Stats”.
Total Trades
Wins
Losses
Breakeven Trades
Total PnL
Can be reset or filtered by date.
8. How to Use
Load the Indicator in TradingView.
Select Gold (XAUUSD) on your preferred scalping timeframe (1m, 5m, 15m).
Adjust settings:
Use default gold scalping settings for quick start.
Enable/disable filters according to your style.
Wait for a Buy/Sell alert.
Confirm visually that all desired conditions align.
Place trade with calculated lot size, SL, and TP levels shown on chart.
Let trade run – the indicator manages Break Even & Partial Close if enabled.
9. Recommended Timeframes
Scalping: 1m, 5m, 15m
Day Trading: 15m, 30m, 1H
Swing: 4H, Daily (adjust settings accordingly)

FVG (Nephew sam remake)Hello i am making my own FVG script inspired by Nephew Sam as his fvg code is not open source. My goal is to replicate his Script and then add in alerts and more functions. Thus, i spent few days trying to code. There is bugs such as lower time frame not showing higher time frame FVG.
This script automatically detects and visualizes Fair Value Gaps (FVGs) — imbalances between demand and supply — across multiple timeframes (15-minute, 1-hour, and 4-hour).
15m chart shows:
15m FVGs (green/red boxes)
1H FVGs (lime/maroon)
4H FVGs (faded green/red with borders) (Bugged For now i only see 1H appearing)
1H chart shows:
1H FVGs
4H FVGs
4H chart shows:
4H FVGs only
There is the function to auto close FVG when a future candle fully disrespected it.
You're welcome to:
🔧 Customize the appearance: adjust box colors, transparency, border style
🧪 Add alerts: e.g., when price enters or fills a gap
📅 Expand to Daily/Weekly: just copy the logic and plug in "D" or "W" as new layers
📈 Build confluence logic: combine this with order blocks, liquidity zones, or ICT concepts
🧠 Experiment with entry signals: e.g., candle confirmation on return to FVG
🚀 Improve performance: if you find a lighter way to track gaps, feel free to optimize!

SCE Price Action SuiteThis is an indicator designed to use past market data to mark key price action levels as well as provide a different kind of insight. There are 8 different features in the script that users can turn on and off. This description will go in depth on all 8 with chart examples.
#1 Absorption Zones
I defined Absorption Zones as follows.
//----------------------------------------------
//---------------Absorption---------------------
//----------------------------------------------
box absorptionBox = na
absorptionBar = ta.highest(bodySize, absorptionLkb)
bsab = ta.barssince(bool(ta.change(absorptionBar)))
if bsab == 0 and upBar and showAbsorption
absorptionBox := box.new(left = bar_index - 1, top = close, right = bar_index + az_strcuture, bottom = open, border_color = color.rgb(0, 80, 75), border_width = boxLineSize, bgcolor = color.rgb(0, 80, 75))
absorptionBox
else if bsab == 0 and downBar and showAbsorption
absorptionBox := box.new(left = bar_index - 1, top = close, right = bar_index + az_strcuture, bottom = open, border_color = color.rgb(105, 15, 15), border_width = boxLineSize, bgcolor = color.rgb(105, 15, 15))
absorptionBox
What this means is that absorption bars are defined as the bars with the largest bodies over a selected lookback period. Those large bodies represent areas where price may react. I was inspired by the concept of a Fair Value Gap for this concept. In that body price may enter to be a point of support or resistance, market participants get “absorbed” in the area so price can continue in whichever direction.
#2 Candle Wick Theory/Strategy
I defined Candle Wick Theory/Strategy as follows.
//----------------------------------------------
//---------------Candle Wick--------------------
//----------------------------------------------
highWick = upBar ? high - close : downBar ? high - open : na
lowWick = upBar ? open - low : downBar ? close - low : na
upWick = upBar ? close + highWick : downBar ? open + highWick : na
downWick = upBar ? open - lowWick : downBar ? close - lowWick : na
downDelivery = upBar and downBar and high > upWick and highWick > lowWick and totalSize > totalSize and barstate.isconfirmed and session.ismarket
upDelivery = downBar and upBar and low < downWick and highWick < lowWick and totalSize > totalSize and barstate.isconfirmed and session.ismarket
line lG = na
line lE = na
line lR = na
bodyMidpoint = math.abs(body) / 2
upWickMidpoint = math.abs(upWickSize) / 2
downWickkMidpoint = math.abs(downWickSize) / 2
if upDelivery and showCdTheory
cpE = chart.point.new(time, bar_index - 1, downWickkMidpoint)
cpE2 = chart.point.new(time, bar_index + bl, downWickkMidpoint)
cpG = chart.point.new(time, bar_index + bl, downWickkMidpoint * (1 + tp))
cpR = chart.point.new(time, bar_index + bl, downWickkMidpoint * (1 - sl))
cpG1 = chart.point.new(time, bar_index - 1, downWickkMidpoint * (1 + tp))
cpR1 = chart.point.new(time, bar_index - 1, downWickkMidpoint * (1 - sl))
lG := line.new(cpG1, cpG, xloc.bar_index, extend.none, color.green, line.style_solid, 1)
lE := line.new(cpE, cpE2, xloc.bar_index, extend.none, color.white, line.style_solid, 1)
lR := line.new(cpR1, cpR, xloc.bar_index, extend.none, color.red, line.style_solid, 1)
lR
else if downDelivery and showCdTheory
cpE = chart.point.new(time, bar_index - 1, upWickMidpoint)
cpE2 = chart.point.new(time, bar_index + bl, upWickMidpoint)
cpG = chart.point.new(time, bar_index + bl, upWickMidpoint * (1 - tp))
cpR = chart.point.new(time, bar_index + bl, upWickMidpoint * (1 + sl))
cpG1 = chart.point.new(time, bar_index - 1, upWickMidpoint * (1 - tp))
cpR1 = chart.point.new(time, bar_index - 1, upWickMidpoint * (1 + sl))
lG := line.new(cpG1, cpG, xloc.bar_index, extend.none, color.green, line.style_solid, 1)
lE := line.new(cpE, cpE2, xloc.bar_index, extend.none, color.white, line.style_solid, 1)
lR := line.new(cpR1, cpR, xloc.bar_index, extend.none, color.red, line.style_solid, 1)
lR
First I get the size of the wicks for the top and bottoms of the candles. This depends on if the bar is red or green. If the bar is green the wick is the high minus the close, if red the high minus the open, and so on. Next, the script defines the upper and lower bounds of the wicks for further comparison. If the candle is green, it's the open price minus the bottom wick. If the candle is red, it's the close price minus the bottom wick, and so on. Next we have the condition for when this strategy is present.
Down delivery:
Occurs when the previous candle is green, the current candle is red, and:
The high of the current candle is above the upper wick of the previous candle.
The size of the current candle's top wick is greater than its bottom wick.
The total size of the previous candle is greater than the total size of the current candle.
The current bar is confirmed (barstate.isconfirmed).
The session is during market hours (session.ismarket).
Up delivery:
Occurs when the previous candle is red, the current candle is green, and:
The low of the current candle is below the lower wick of the previous candle.
The size of the current candle's bottom wick is greater than its top wick.
The total size of the previous candle is greater than the total size of the current candle.
The current bar is confirmed.
The session is during market hours
Then risk is plotted from the percentage that users can input from an ideal entry spot.
#3 Candle Size Theory
I defined Candle Size Theory as follows.
//----------------------------------------------
//---------------Candle displacement------------
//----------------------------------------------
line lECD = na
notableDown = bodySize > bodySize * candle_size_sensitivity and downBar and session.ismarket and barstate.isconfirmed
notableUp = bodySize > bodySize * candle_size_sensitivity and upBar and session.ismarket and barstate.isconfirmed
if notableUp and showCdSizeTheory
cpE = chart.point.new(time, bar_index - 1, close)
cpE2 = chart.point.new(time, bar_index + bl_strcuture, close)
lECD := line.new(cpE, cpE2, xloc.bar_index, extend.none, color.rgb(0, 80, 75), line.style_solid, 3)
lECD
else if notableDown and showCdSizeTheory
cpE = chart.point.new(time, bar_index - 1, close)
cpE2 = chart.point.new(time, bar_index + bl_strcuture, close)
lECD := line.new(cpE, cpE2, xloc.bar_index, extend.none, color.rgb(105, 15, 15), line.style_solid, 3)
lECD
This plots candles that are “notable” or out of the ordinary. Candles that are larger than the last by a value users get to specify. These candles' highs or lows, if they are green or red, act as levels for support or resistance.
#4 Candle Structure Theory
I defined Candle Structure Theory as follows.
//----------------------------------------------
//---------------Structure----------------------
//----------------------------------------------
breakDownStructure = low < low and low < low and high > high and upBar and downBar and upBar and downBar and session.ismarket and barstate.isconfirmed
breakUpStructure = low > low and low > low and high < high and downBar and upBar and downBar and upBar and session.ismarket and barstate.isconfirmed
if breakUpStructure and showStructureTheory
cpE = chart.point.new(time, bar_index - 1, close)
cpE2 = chart.point.new(time, bar_index + bl_strcuture, close)
lE := line.new(cpE, cpE2, xloc.bar_index, extend.none, color.teal, line.style_solid, 3)
lE
else if breakDownStructure and showStructureTheory
cpE = chart.point.new(time, bar_index - 1, open)
cpE2 = chart.point.new(time, bar_index + bl_strcuture, open)
lE := line.new(cpE, cpE2, xloc.bar_index, extend.none, color.red, line.style_solid, 3)
lE
It is a series of candles to create a notable event. 2 lower lows in a row, a lower high, then green bar, red bar, green bar is a structure for a breakdown. 2 higher lows in a row, a higher high, red bar, green bar, red bar for a break up.
#5 Candle Swing Structure Theory
I defined Candle Swing Structure Theory as follows.
//----------------------------------------------
//---------------Swing Structure----------------
//----------------------------------------------
line htb = na
line ltb = na
if totalSize * swing_struct_sense < totalSize and upBar and downBar and high > high and showSwingSturcture and session.ismarket and barstate.isconfirmed
cpS = chart.point.new(time, bar_index - 1, high)
cpE = chart.point.new(time, bar_index + bl_strcuture, high)
htb := line.new(cpS, cpE, xloc.bar_index, color = color.red, style = line.style_dashed)
htb
else if totalSize * swing_struct_sense < totalSize and downBar and upBar and low > low and showSwingSturcture and session.ismarket and barstate.isconfirmed
cpS = chart.point.new(time, bar_index - 1, low)
cpE = chart.point.new(time, bar_index + bl_strcuture, low)
ltb := line.new(cpS, cpE, xloc.bar_index, color = color.teal, style = line.style_dashed)
ltb
A bearish swing structure is defined as the last candle’s total size, times a scalar that the user can input, is less than the current candles. Like a size imbalance. The last bar must be green and this one red. The last high should also be less than this high. For a bullish swing structure the same size imbalance must be present, but we need a red bar then a green bar, and the last low higher than the current low.
#6 Fractal Boxes
I define the Fractal Boxes as follows
//----------------------------------------------
//---------------Fractal Boxes------------------
//----------------------------------------------
box b = na
int indexx = na
if bar_index % (n * 2) == 0 and session.ismarket and showBoxes
b := box.new(left = bar_index, top = topBox, right = bar_index + n, bottom = bottomBox, border_color = color.rgb(105, 15, 15), border_width = boxLineSize, bgcolor = na)
indexx := bar_index + 1
indexx
The idea of this strategy is that the market is fractal. It is considered impossible to be able to tell apart two different time frames from just the chart. So inside the chart there are many many breakouts and breakdowns happening as price bounces around. The boxes are there to give you the view from your timeframe if the market is in a range from a time frame that would be higher than it. Like if we are inside what a larger time frame candle’s range. If we break out or down from this, we might be able to trade it. Users can specify a lookback period and the box is that period’s, as an interval, high and low. I say as an interval because it is plotted every n * 2 bars. So we get a box, price moves, then a new box.
#7 Potential Move Width
I define the Potential Move Width as follows
//----------------------------------------------
//---------------Move width---------------------
//----------------------------------------------
velocity = V(n)
line lC = na
line l = na
line l2 = na
line l3 = na
line l4 = na
line l5 = na
line l6 = na
line l7 = na
line l8 = na
line lGFractal = na
line lRFractal = na
cp2 = chart.point.new(time, bar_index + n, close + velocity)
cp3 = chart.point.new(time, bar_index + n, close - velocity)
cp4 = chart.point.new(time, bar_index + n, close + velocity * 5)
cp5 = chart.point.new(time, bar_index + n, close - velocity * 5)
cp6 = chart.point.new(time, bar_index + n, close + velocity * 10)
cp7 = chart.point.new(time, bar_index + n, close - velocity * 10)
cp8 = chart.point.new(time, bar_index + n, close + velocity * 15)
cp9 = chart.point.new(time, bar_index + n, close - velocity * 15)
cpG = chart.point.new(time, bar_index + n, close + R)
cpR = chart.point.new(time, bar_index + n, close - R)
if ((bar_index + n) * 2 - bar_index) % n == 0 and session.ismarket and barstate.isconfirmed and showPredictionWidtn
cp = chart.point.new(time, bar_index, close)
cpG1 = chart.point.new(time, bar_index, close + R)
cpR1 = chart.point.new(time, bar_index, close - R)
l := line.new(cp, cp2, xloc.bar_index, extend.none, color.aqua, line.style_solid, 1)
l2 := line.new(cp, cp3, xloc.bar_index, extend.none, color.aqua, line.style_solid, 1)
l3 := line.new(cp, cp4, xloc.bar_index, extend.none, color.red, line.style_solid, 1)
l4 := line.new(cp, cp5, xloc.bar_index, extend.none, color.red, line.style_solid, 1)
l5 := line.new(cp, cp6, xloc.bar_index, extend.none, color.teal, line.style_solid, 1)
l6 := line.new(cp, cp7, xloc.bar_index, extend.none, color.teal, line.style_solid, 1)
l7 := line.new(cp, cp8, xloc.bar_index, extend.none, color.blue, line.style_solid, 1)
l8 := line.new(cp, cp9, xloc.bar_index, extend.none, color.blue, line.style_solid, 1)
l8
By using the past n bar’s velocity, or directional speed, every n * 2 bars. I can use it to scale the close value and get an estimate for how wide the next moves might be.
#8 Linear regression
//----------------------------------------------
//---------------Linear Regression--------------
//----------------------------------------------
lr = showLR ? ta.linreg(close, n, 0) : na
plot(lr, 'Linear Regression', color.blue)
I used TradingView’s built in linear regression to not reinvent the wheel. This is present to see past market strength of weakness from a different perspective.
User input
Users can control a lot about this script. For the strategy based plots you can enter what you want the risk to be in percentages. So the default 0.01 is 1%. You can also control how far forward the line goes.
Look back at where it is needed as well as line width for the Fractal Boxes are controllable. Also users can check on and off what they would like to see on the charts.
No indicator is 100% reliable, do not follow this one blindly. I encourage traders to make their own decisions and not trade solely based on technical indicators. I encourage constructive criticism in the comments below. Thank you.

SMC Structures and FVGThe SMC Structures and FVG indicator allows the user to easily identify trend continuations (Break Of Structure) or trend changes (CHange Of CHaracter) on any time frame. In addition, it display all FVG areas, whether they are bullish, bearish, or even mitigated.
Fair Value Gap :
The FVG process shows every bullish, bearish or even mitigated FVG liquidity area. When a FVG is fully mitigated it will directly be removed of the chart.
There is an history of FVG to show. By selecting specific number of FVG to show in the chart, the user can focus its analysis on lasts liquidity area.
Here's the rules for FVG color :
Green when it's a bullish FVG and has not been mitigated
Red when it's a bearish FVG and has not been mitigated
Gray when the bullish / bearish FVG has been mitigated
Removed when the FVG has been fully mitigated
Structures analysis:
The Structure process show BOS in grey lines and CHoCH in yellow lines. It shows to the user the lasts price action pattern.
The blue lines are the high value and the low value of the current structure.